Seeing Speech: watch speech from the inside
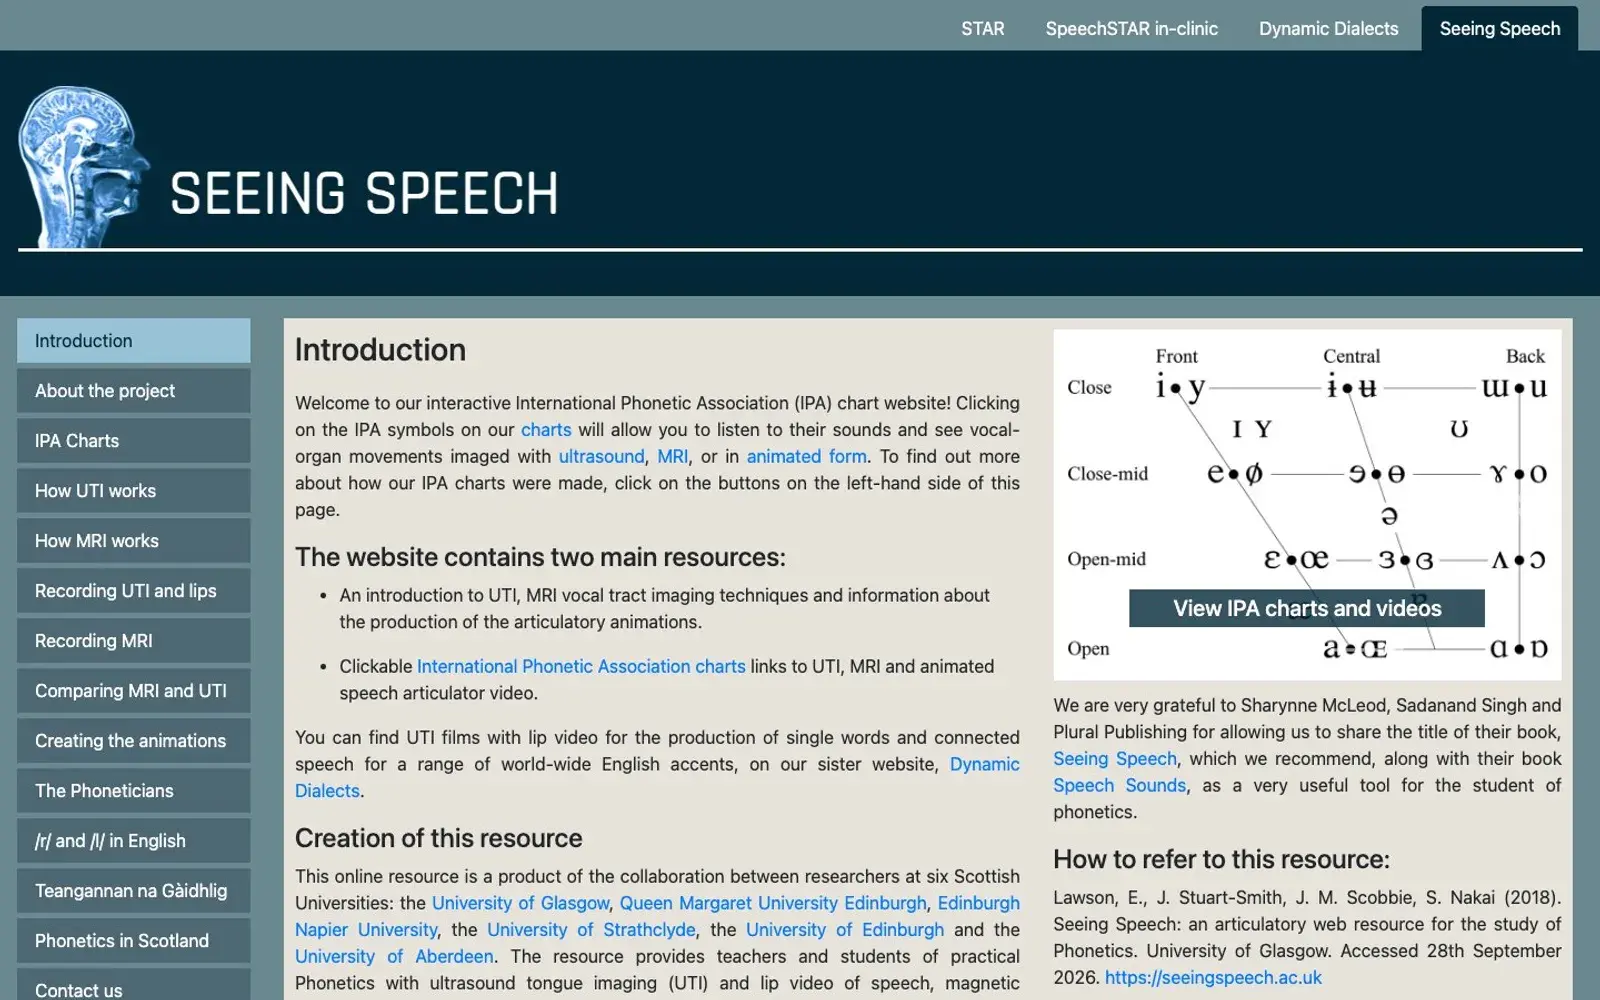
An interactive International Phonetic Alphabet chart: click a symbol to hear the sound and watch MRI and ultrasound footage of the tongue and lips as it's made.
What it is
Seeing Speech is a site built around interactive charts of the International Phonetic Alphabet. Click any symbol and you hear the sound, and next to it you see what's happening inside the mouth at that moment: MRI video, ultrasound of the tongue paired with lip video, or an animated cross-section of the vocal tract. It was made by researchers at six Scottish universities, including Glasgow, Edinburgh and Aberdeen.
Why we picked it
We talk all day without having much idea what's physically going on. Here you can literally watch it: the tongue pulling back for a "k", the lips sealing for a "p", sounds that seem alike to the ear behaving quite differently inside. Watching an MRI of a talking head is strange and hypnotic at the same time, a bit like seeing an X-ray of your own hand for the first time.
It isn't a toy, though. It's a teaching resource for students of practical phonetics, and it's clearly been made with care. There's also a sister site, Dynamic Dialects, with ultrasound recordings of words and connected speech in English accents from around the world.
Where to start
- Open the IPA charts and pick the MRI view; start with the consonants you use every day.
- Switch to ultrasound and compare how the same sound looks.
- Find sounds your own language doesn't have and see how they differ from the ones you know.
- Try the animated view, which is the gentlest introduction.
- If accents are your thing, head over to the sister site, Dynamic Dialects.
Who it's for
Language learners fighting with pronunciation, linguistics and speech therapy students, language teachers, actors and voice coaches, and anyone who's ever wondered what's going on in their mouth when they talk.
Quick answers
What's the IPA? The International Phonetic Alphabet, a set of symbols linguists use to write down the sounds of any language.
Who made it? Researchers from six Scottish universities: Glasgow, Queen Margaret University Edinburgh, Edinburgh Napier, Strathclyde, Edinburgh and Aberdeen.
Is it free? Yes, the charts and videos are free to use in the browser.