The Pudding: stories told in charts
An online publication that explains ideas through interactive visual essays: music, language, sports, relationships — all dug out of data and beautifully drawn.
What it is
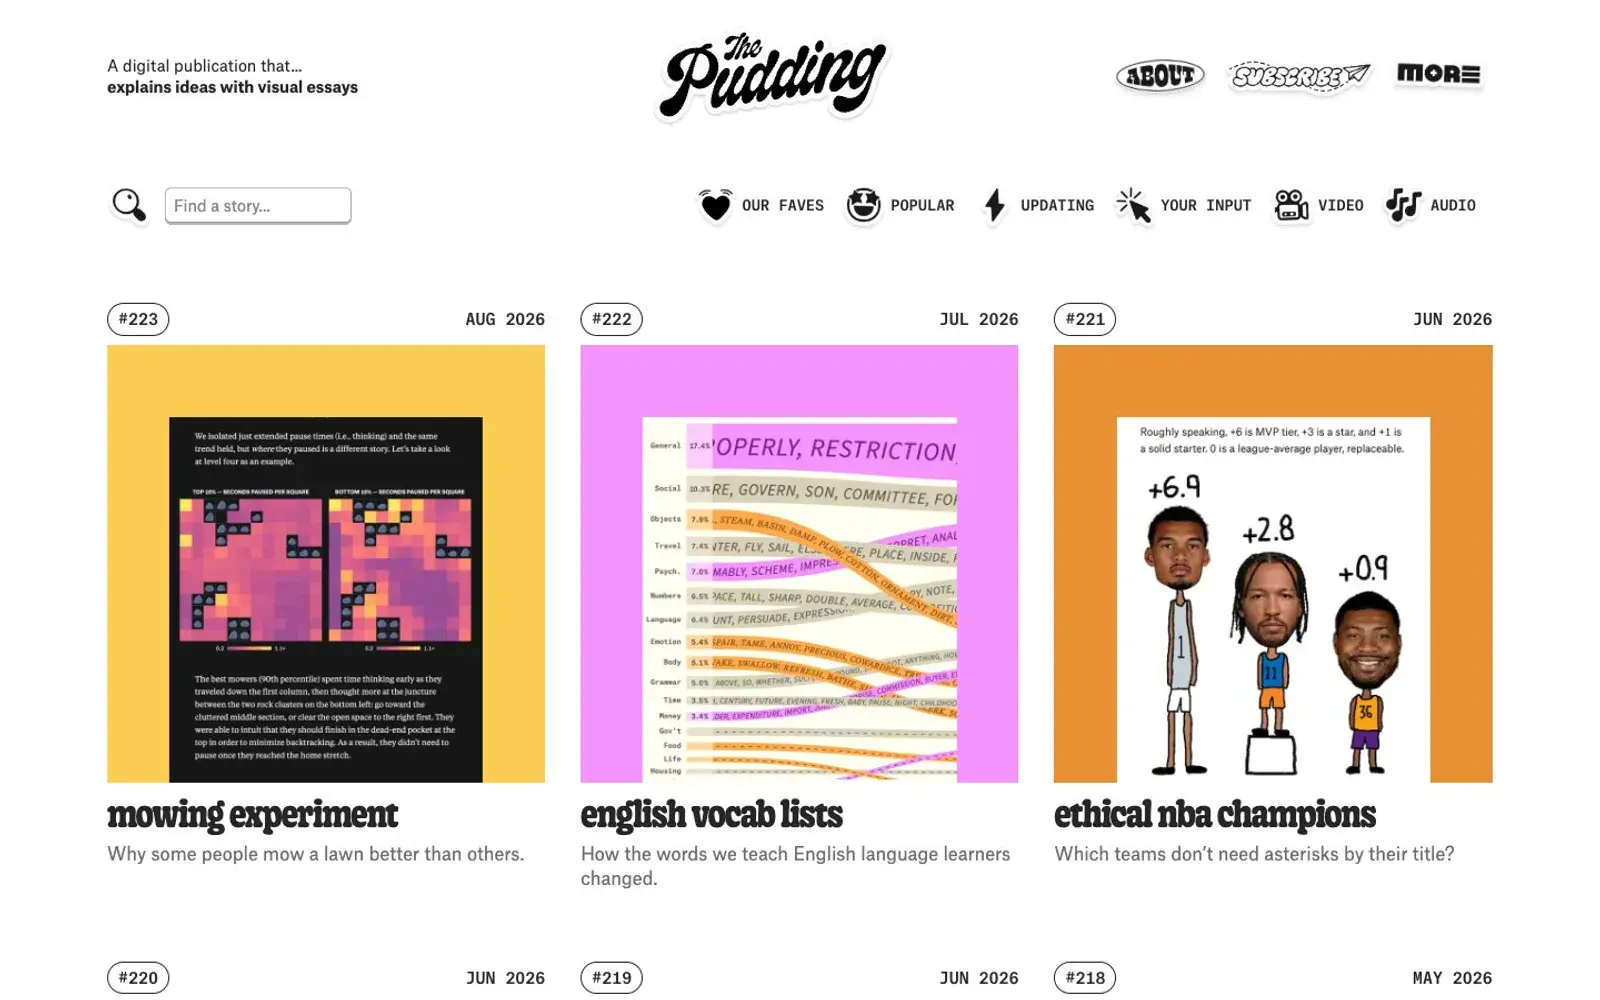
The Pudding is a digital publication that explains ideas with visual essays. Every piece is its own interactive, data-driven project: you scroll, and charts, maps and animations unfold the story step by step. Topics range widely, from music and language to sports, fashion, film, relationships and everyday oddities.
Why we picked it
This is the rare case where data visualization reads like a great longform article. The team takes a question that sounds trivial and digs into it properly. Recent stories include an analysis of 200,000 similes from popular fiction, a look at what America's earliest restaurant menus reveal, and an experiment on why some people mow a lawn better than others. The archive has gems too, like whether you are more likely to die on your birthday, or an attempt to predict a wine's price from the animal on its label.
There are no dull dashboards here. Each project is handcrafted with its own design, and many invite you to take part, whether by answering questions or playing with the data. It is one of the best examples of data storytelling that is both smart and genuinely fun.
Where to start
- Open Our Faves for the team's favorite projects.
- Check Popular to see the most-read stories.
- Try the Your Input section for pieces where you become part of the data.
- Browse Video and Audio if you would rather watch or listen.
- Sign up for the newsletter to get new stories in your inbox.
Who it's for
Fans of popular science and infographics, designers and data analysts, journalists, and anyone who wants something smart to read that never feels like homework.
Quick answers
Is The Pudding free to read? Yes, all stories are free to read with no paywall.
What kind of stories does The Pudding publish? Interactive visual essays built on data, covering music, language, sports, culture and everyday life.
How often are new stories published? Recent issues have come out roughly once a month.